
Infographics turn dense psychology research into something you can scan in a few minutes. Below are our picks for the best psychology infographics online, covering everything from color psychology and birth order to the science behind why so many people fall for hoaxes. Each entry links to the full graphic along with a short explanation of what it covers. Some of these infographics were published several years ago, so treat the statistics as a general reference point and check the original source for the most current data.
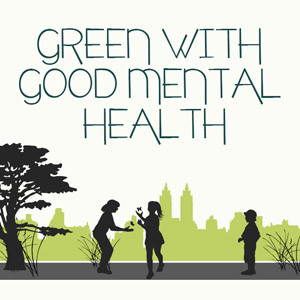
Can Going Green Improve Your Mental Health?
Time spent outdoors among grass and greenery can help reduce symptoms for the more than 7 million U.S. children, or roughly 1 in 9, diagnosed with ADHD. This infographic tours some of the greenest cities in North America, where research links time in green spaces to a range of psychological benefits.
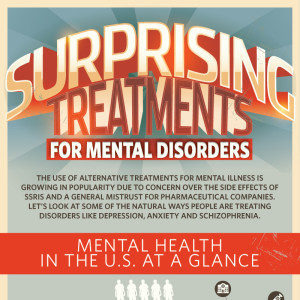
Surprising Alternative Treatments for Mental Disorders
More than 1 in 5 U.S. adults, over 59 million people, live with a mental illness. As concern over pharmaceutical side effects grows nationwide, interest in alternative treatment methods has been growing alongside it. This infographic covers natural treatments that some patients and researchers have explored for depression, anxiety, and personality disorders.
What Can Humans Learn from Animals?
Animals show a far greater depth of emotion and complex thinking than they’re often given credit for. This infographic covers some of the most important life lessons humans can take from the animal kingdom.
Can You Make Yourself Smarter?
Everyone wants a sharper mind, but how much can you actually improve your intelligence? This infographic breaks down proven strategies for strengthening fluid intelligence through puzzles, new languages, meditation, and even power naps.
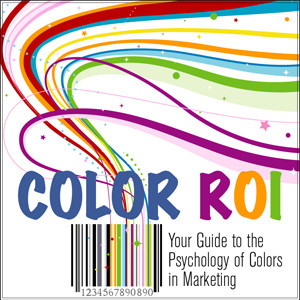
Color ROI: It’s All About Psychology
More than 50% of consumers say color is a major factor in their shopping habits, which makes the color scheme one of the most important considerations in a marketing campaign. This infographic breaks down color harmonies, preferences, and associations.
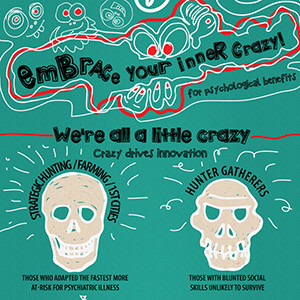
How to Embrace Your Inner Crazy for Psychological Benefits
There are safe, beneficial ways to use your quirks to break routines, spark innovation, and become a high achiever. This infographic details the psychological benefits of embracing your inner crazy if you like thinking outside the box.
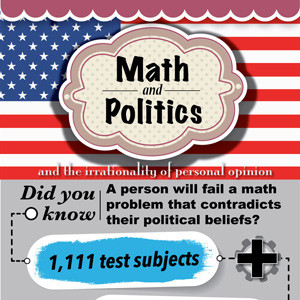
Political views don’t just shape how objectively we look at evidence; research shows they can also affect how we solve math problems. This infographic covers the surprising way people fail at math problems that contradict their political beliefs.
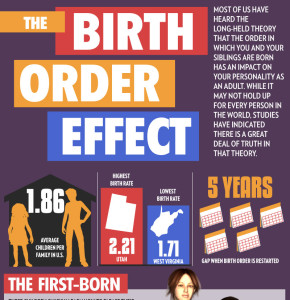
Some research suggests the order in which you and your siblings were born may play a role in personality development, though the science is far from settled. This infographic covers what the research says about first-born, middle, youngest, and only children.
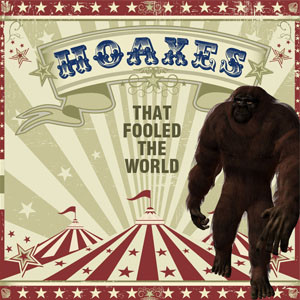
Hoaxes have fooled people long before the internet existed. From the Loch Ness Monster and the Cardiff Giant to the War of the Worlds broadcast and Hitler’s fabricated diaries, this infographic covers some of history’s most famous hoaxes and the psychology behind why they worked.
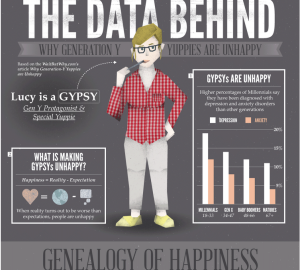
The Data Behind Why Gen-Y Yuppies Are Unhappy
Some research has linked Generation Y to higher reported rates of anxiety and depression compared with earlier generations. This infographic traces the data behind that research and offers some context for the trend.
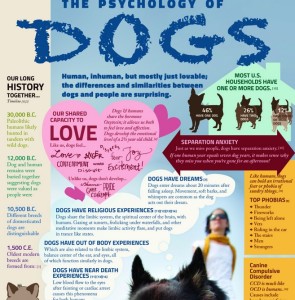
Dogs are the most popular pet in the U.S., found in roughly half of all households. This infographic explores the surprising psychological similarities between humans and their dogs.
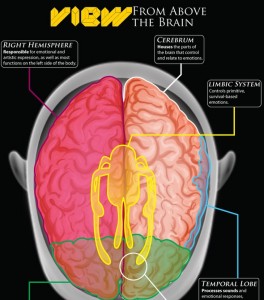
The Brain: A User’s Guide to Emotions
Neuroscientists around the world continue to uncover new details about how the brain processes emotion. This infographic covers the major brain regions involved in emotional processing and what researchers have learned about them.
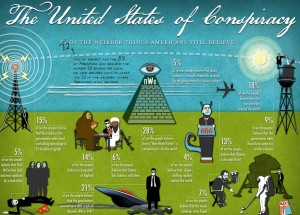
The United States of Conspiracy
Plenty of people hold beliefs that others consider strange, so what leads someone to adopt a conspiracy theory in the first place? This infographic looks at 12 of the more unusual beliefs held in American culture and the psychology behind why people hold them with such conviction.